Sustainable Bottom Line: Labeled sustainable index mutual funds and ETFs cost dramatically less than actively managed counterparts, in some categories more than four times less.
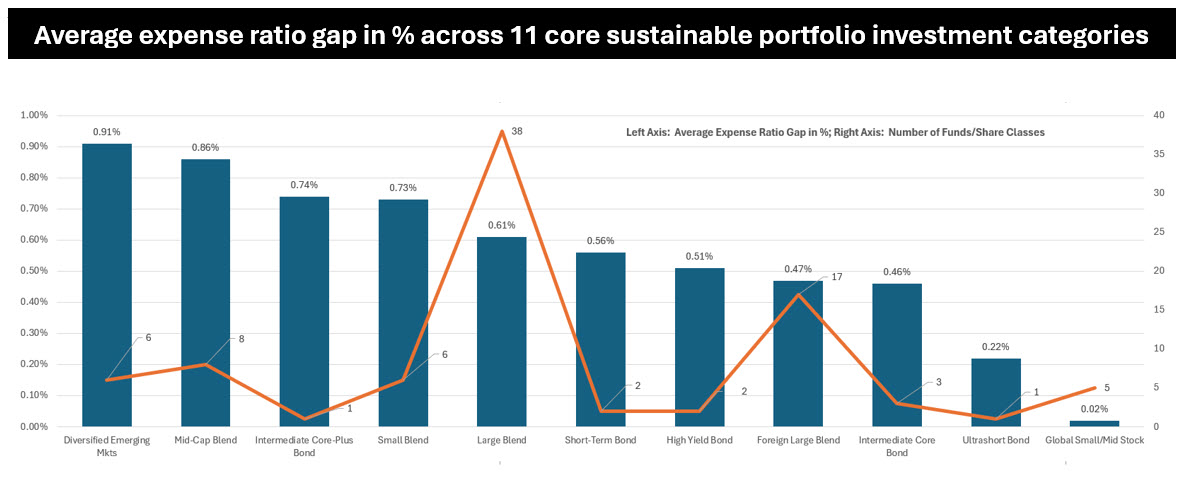 Notes of Explanation: Core sustainable portfolio investment categories listed in descending order, based on the arithmetic average expense gap for each of 11 categories. Sources: Sustainable Research and Analysis LLC and Morningstar.
Observations:
• Across every core sustainable portfolio building block where indexing alternatives exist, sustainable index funds cost dramatically less than their actively managed counterparts, in some categories more than four times less. The gap matters for long-term wealth accumulation, reinforced by strong evidence that active management is challenging and consistent outperformance is typically fleeting, according to data compiled by S&P Dow Jones SPIVA reports*. For purposes of level setting, a core sustainable portfolio holding refers to central investments for portfolios seeking to achieve long-term investment goals in line with sustainable investing preferences by providing a stable foundation and elements of diversification across an expansive universe of stocks and/or funds that include asset classes such as US equities, international equities and fixed income investments as well as various investment categories within asset classes, such as large cap equities or high yield bonds.
• For long-term investors, fund costs are among the most predictable determinants of net return. Unlike market performance, which no manager can guarantee, the expense ratio is charged every year, compounding against the investor’s wealth with mathematical certainty. A seemingly small cost differential can translate into a significant difference in ending wealth over a decade or more.
• Consider two sustainable Large Blend funds, one actively managed, one index. The average actively managed option in this category charges 0.89% per year while the average index fund charges 0.28%. On a $250,000 portfolio, that 0.61% gap costs $1,525 annually in foregone returns. Over 10 years, assuming a 7% gross return figure, that differential compounds to roughly $26,700 in lost wealth before any tax considerations, and $99,400 over 20 years.
• An analysis that’s examines the labeled long-term sustainable funds universe, including mutual funds (all share classes) and ETFs, as classified by Morningstar, with a focus on categories that qualify for consideration as core portfolio building blocks and those with at least ten funds/share class offerings (combined active and passive funds), shows that 11 investment categories meet the criteria to qualify as core holdings. Across these 11 categories, out of a total of 72 categories, the pattern is unambiguous: index funds charge less, often far less.
• Equities: Emerging Markets and Mid-Cap Offer the Starkest Contrast. Diversified Emerging Markets and Mid-Cap Blend show the largest absolute gaps, at 0.91% and 0.86% per year, respectively. Both categories are well-served by index offerings in the sustainable universe, with six emerging market index funds and eight mid-cap index funds available. The case for cost discipline is especially strong here. Both categories carry higher inherent volatility and paying an additional 0.86–0.91% per year in expenses creates a formidable hurdle for active managers to overcome through stock selection. That hurdle is especially daunting when viewed within the context of data showing that based on risk adjusted returns evaluated relative to their benchmarks over the 10-to-20 year intervals through the end of 2025, between upwards of 83% to 92% of funds in these two investment categories underperformed their benchmarks.
• Fixed Income: The Indexing Advantage Is Equally Compelling. Core fixed income categories show gaps that are substantial in the context of the modest total returns bonds typically offer. Intermediate Core-Plus Bond funds average 0.86% for active vs. 0.12% for index — a 0.74% gap. Given that the Bloomberg U.S. Aggregate Bond Index has historically returned around 4–5% annually, surrendering 0.74% to fund expenses is a meaningful drag. Similarly, Short-Term Bond (0.56% gap) and Intermediate Core Bond (0.46% gap) underscore the logic of indexing in rate-sensitive categories where manager alpha is difficult to sustain consistently. Based on data covering investment-grade intermediate funds, 64% and 87% of funds underperformed their benchmarks on a risk adjusted basis over the 10- and 20-year intervals to year-end 2025, respectively.
• Large Blend: The Largest Category, a 0.61% Gap. Large Blend is the most heavily populated category in the sustainable universe, with 143 fund and share class offerings holding $162.7 billion in assets. Actively managed options average 0.89%, while 38 index alternatives average 0.28%. Notably, index funds in this category hold more assets ($91.9 billion) than their active counterparts ($70.8 billion), suggesting sustainable investors have already recognized the cost advantage and high likelihood of active management underperformance, and voted with their dollars. According to SPIVA, only about 17% of active managers outperformed their benchmarks on a risk adjusted basis over the trailing 10-years while only 8% did so over the trailing 20 years to year-end 2025.
• Not all categories offer meaningful indexing alternatives. Investors seeking to invest in labeled sustainable mutual funds or ETFs have fewer choices than those selecting from the universe of conventional funds. For example, based on data as of year-end 2025, there are a total of 228 taxable and municipal sustainable mutual funds, including share classes, and ETFs, versus 6,384 conventional funds/share classes, or 28X the number of sustainable funds. As for index tracking sustainable funds, the disparity is even greater. There are some 25 sustainable taxable and municipal index funds versus 500 conventional funds, or 33X the number. Of the 11 investment categories that qualify as core holdings, there are four investment categories with only one, two or three index fund offerings. In turn, the limited supply of index products in these areas may be keeping index expenses higher than they might be with the benefit of greater competition. In the absence of more rigorous index fund options, sustainable investors must evaluate active managers and their funds more closely on their merits. As an alternative, however, investors willing to consider an ESG integration** approach to sustainable investing can take advantage of the option to expand the variety of eligible index funds beyond labeled funds by considering conventional investment options offered by investment management firms that practice ESG integration across their entire franchise or, in some cases, on a more limited basis delineated on an asset class basis. For further information, refer to “Taking account of an investment manager’s stewardship principles.”
*S&P Indices versus Active (SPIVA) scorecards are semiannual reports published by S&P Dow Jones Indices that compare the performance of active equity and fixed income mutual funds against their benchmarks over different time horizons.
**ESG Integration. This is a widely practiced (some data suggests the most widely practiced) investment approach by which environmental, social and governance factors and risks are systematically analyzed and, when these are deemed financially relevant and material to an entity’s performance, they will influence decisions on whether to buy or hold a security, and to what extent. Such considerations may lead to the liquidation of a security from the portfolio but at the same time, these factors may also identify investment opportunities.