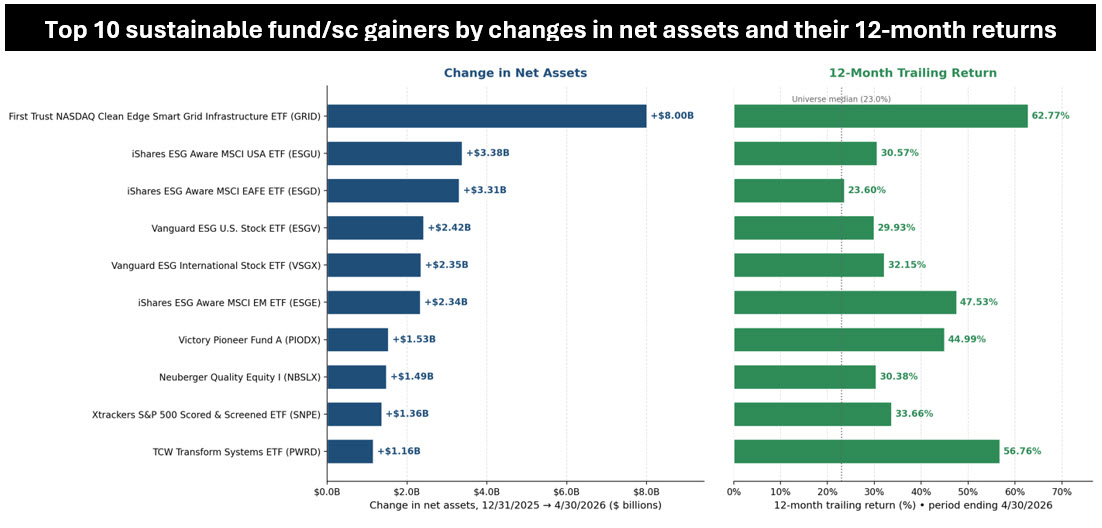
Sustainable Bottom Line: The top 10 labeled L-T sustainable fund assets gainers during the first four months of 2026 split cleanly into three sustainability groupings.
Notes of Explanation: TData to April 30, 2026. Top gainers by changes in net assets limited to long-term funds (i.e. excluding money market funds). For mutual funds with multiple share classes, i.e. Victory Pioneer Fund A and Neuberger Quality Equity I only the top gaining share class and corresponding assets and performance are displayed. Sources: Morningstar and Sustainable Research and Analysis LLC.
Observations:
• The top 10 long-term labeled sustainable fund asset gainers during the first four months of 2026 added $27.3 billion in net assets. These active and passively managed mutual funds and ETFs, which recorded an average gain of 39.2% during the trailing 12 months, generated total returns ranging from 23.6% to 62.8%. This is against a backdrop during which aggregate net assets of labeled long-term sustainable fund universe rose from $374.6 billion as of year-end 2025 to $387.2 billion on April 30, 2026, for a net gain of $12.6 billion, or 3.4%, and an average increase across all long-term labeled sustainable funds of 24.6%. The increase was attributable to market appreciation, offset by net outflows as well as fund liquidations/delistings and/or fund re-brandings. The number of mutual funds and ETFs continued to decline during the four-month interval.
• The ten gainers consist of seven index tracking ETFs and three actively managed funds, including one ETF. These funds also split cleanly into three sustainability groupings. First, broad-market ESG-aware index ETFs (ESGU, ESGD, ESGE). These funds offer MSCI-optimized exposure that tilts toward higher ESG ratings while staying close to the parent index, with activity exclusions on tobacco, controversial weapons, civilian firearms, thermal coal and oil sands. (Negative/positive screenings and/or exclusions). Second, broad-market exclusion-only index ETFs (ESGV, VSGX, SNPE). The funds these don’t optimize toward ESG leadership; they apply hard screens (fossil fuels, weapons, vice stocks, UN Global Compact violators) and let the rest of the market stand, with SNPE adding S&P best-in-class scoring within GICS industry groups on top. ((Negative/positive screenings and/or exclusions). Third, thematic and active strategies (PIODX, NBSLX, PWRD). These include ESG-integrated active mutual funds (PIODX, NBSLX) and actively managed energy-transition thematic ETF (PWRD). Also included is a variation on the same theme, that is a pure clean-grid thematic index (GRID) but one that does not screen securities based on ESG considerations. Rather, its sustainability angle comes from the activity-based selection of companies enabling decarbonization of the electricity system. (Thematic).
• The trailing-returns picture is consistent with how risk concentration in each grouping paid off over the year: the two pure thematic and energy-transition funds (GRID +62.8%, PWRD +56.8%) and the emerging-markets ESG ETF (ESGE +47.5%) topped the list; the active U.S. quality / value mutual funds (PIODX +45.0%, NBSLX +30.4%) and the U.S. broad-market exclusion funds (ESGV, SNPE) clustered in the +30% range; and the developed-international ESG ETF (ESGD) was the only group member at around the long-term sustainable funds universe average and median (24.6%, 23%).