Observations:
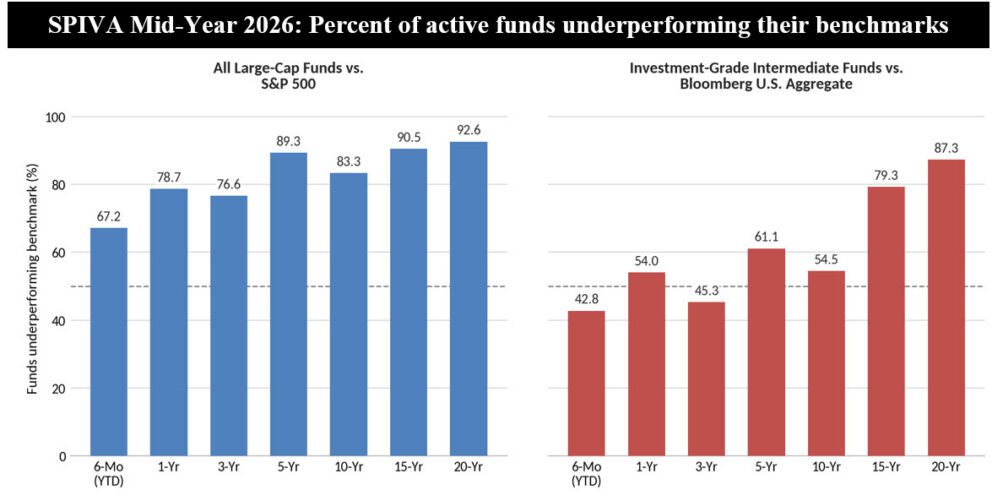
• Conditions in the first half of 2026 were about as favorable for stock pickers as they get. After its worst quarter since Q3 2022, the S&P 500 posted its best quarter since Q2 2020 to finish the period up 10%. Stock-level dispersion reached its highest level since 2008, market breadth widened and the weight of the Magnificent 7 in the index slipped from 34.9% to 31.6% (1). Yet 67% of actively managed large-cap funds still underperformed the S&P 500, according to S&P Dow Jones Indices’ SPIVA U.S. Mid-Year 2026 Scorecard (S&P Indices Versus Active). That is an improvement from the 79% recorded for full-year 2025, but hardly a turnaround.
• Extend the horizon and the results deteriorate. Large-cap underperformance rises to 89% over five years, 83% over 10 years, 90% over 15 years and 93% over 20 years. The average large-cap fund gained 8.2% in the first half, trailing the index by 2.0 percentage points on an equal-weighted basis, although the asset-weighted return of 10.0% suggests that larger funds held up better. Only 37% of the large-cap funds operating 20 years ago are still around.
• Mid-cap and small-cap managers fared worse than their large-cap peers over the six months. Some 74% of mid-cap funds and 69% of small-cap funds lagged their benchmarks, even as the S&P MidCap 400 and S&P SmallCap 600 surged 17% and 24%, respectively. With smaller stocks leading, these managers lost the edge they typically gain by tilting toward larger names. Small-cap funds held up comparatively well over three and five years, with underperformance rates of 55% and 56%, but over 20 years both groups converge with large caps at about 91%.
• Bond managers present a different picture. Just 43% of investment-grade intermediate funds underperformed the Bloomberg U.S. Aggregate in the first half, and results over one, three, five and 10 years ranged from 45% to 61%, close to a coin flip. Shifting rate regimes helped, with shorter duration rewarded in the first quarter and longer duration in the second. Across all 16 fixed income categories, the average underperformance rate was 38% versus 60% for equities. Still, margins were thin. The average equal-weighted fund returned 0.61% versus 0.62% for the index in the half year, and 1.55% versus 1.54% annualized over 10 years. Over 15 and 20 years, underperformance climbs to 79% and 87%.
• SPIVA does not isolate labeled sustainable funds, but its findings are likely to apply to them. A preliminary analysis of actively managed labeled sustainable funds covering the same four investment categories to August 30, 2026 which are far fewer in number and subject to survivorship bias (that is, funds that merged, liquidated or re-branded are excluded), indicates that these funds trailed their benchmarks at SPIVA-like rates over one and three years but fared worse over five years. Thus, the findings argue for scrutiny of fees and track records before paying for active management in large-cap equities. In intermediate-term bonds, where active managers have come closer to breaking even, the case for active sustainable strategies is stronger.
(1) The Magnificent 7 consists of Alphabet, Amazon, Apple, Meta Platforms, Microsoft, Nvidia and Tesla.