The Bottom Line: Green investment funds gained only $7.5 million while green bonds scored big by adding $72.3 billion and pushing volume to $349.5 billion.
Summary
Assets of seven green funds, including five mutual funds and two ETFs, gained a modest $7.5 million, or 1%, in September, to end the month at $1.43 billion in total net assets. Green bond funds posted an average return of -0.78 basis point (bps) in September, besting the Bloomberg US Aggregate Bond Index by 9 bps. Global green bonds experienced a surge in new issue volume, adding $72.3 billion versus $10.8 billion in August and pushing the year-to-date volume to $349.5 billion based on adjusted data. This level already exceeds last calendar year’s $269.5 billion with three full months left in 2021.
Green bond fund assets added just $7.5 million to end month at $1.43 billion
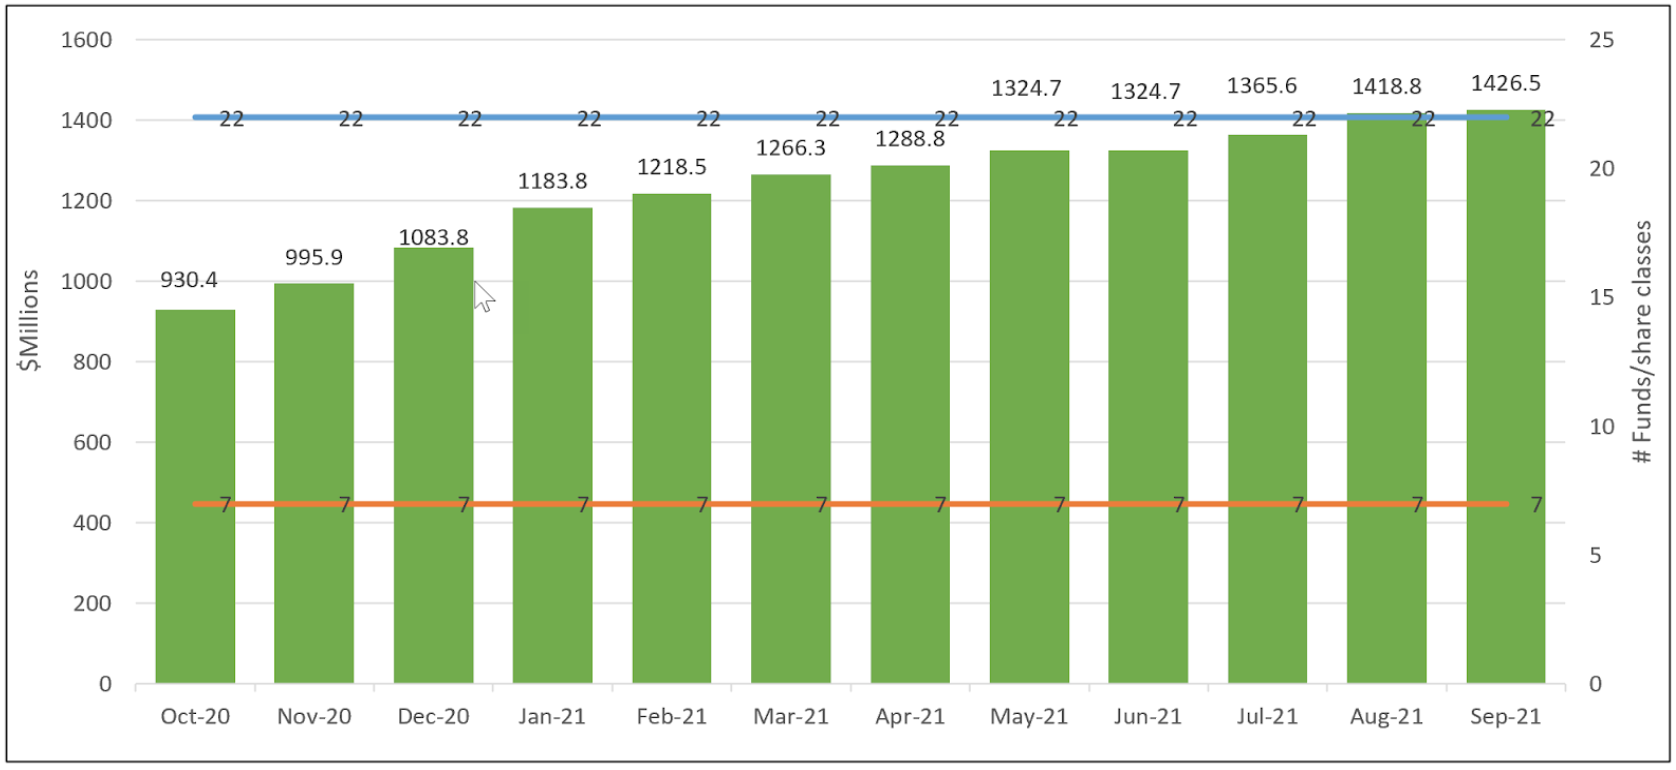
Assets of seven green funds, including five mutual funds and two ETFs, gained a modest $7.5 million, or 1%, in September. This represents the second narrowest monthly net increase so far this year as well as the narrowest monthly increase since June when net assets remained unchanged. While positive, the month’s net increase was significantly lower than the average $42 million monthly gain this year and the average $40 million per month since January 2020. Still, green bond fund assets under management reached a new high level $1.43 billion. Refer to Chart 1. Only three funds posted positive net inflows, including the Calvert Green Bond Fund that added $10.6 million. Of that sum, $10.1 was sourced to institutional investors. The other two funds included the Mirova Global Green Bond Fund that gained $0.8 million and the Franklin Municipal Green Fund whose assets increased by $0.6 million to close the month at $9.7 million.
While the Calvert Green Bond Fund, the largest of the seven green bond funds that make up the segment, added assets, the second and third largest funds experienced outflows. The iShares Global Green Bond ETF sustained net outflows of $3 million to end September with $240.9 million in assets while the VanEck Green Bond ETF dropped $1.2 million to end the month at $97.8 million.
Two recently registered green bond ETFs, both to be managed by Tuttle Capital Management LLC, have again deferred their effective date, this time to October 30, 2021.
Green bond funds posted an average return of -0.78 bps in September, besting the Bloomberg US Aggregate Bond Index by 9 bps
Green bond funds, on average, outperformed the investment-grade intermediate bonds index in September, both with and without the inclusion of the Franklin Municipal Green Bond Fund. Green bond funds posted an average return of -78 bps versus the -87 bps decline recorded by the Bloomberg US Aggregate Bond Index and -122 bps drop registered by the ICE BofAML Green Bond Index Hedged US. This was the third consecutive month during which green bonds, on average, either exceeded or met the performance results achieved by the Bloomberg index. Individual fund results ranged from a high of -62 bps to -53 bps achieved by the PIMCO Climate Bond Fund across its five share classes and low of -121 bps posted by the iShares Global Green Bond ETF. The iShares Global Green Bond ETF, with its more expansive worldwide investment mandate, exceeded the performance of the ICE BofAML Green Bond Index Hedged US by 1 bps. Refer to Table 1.
Even without the uplift provided by the Franklin municipal green bond fund that seeks to maximize income exempt from federal income taxes by investing in green bonds issued by municipal entities, green bonds, on average, exceeded the performance results delivered by the domestic and global green bond indices over the trailing twelve-month period. Only one fund, the iShares Global Green Bond ETF posted negative results during the same interval, but still beat its global benchmark. Beyond the trailing one-year interval, only three green bond funds, accounting for a total of 6 funds/share classes, have been in operation for three years. Of these, five funds/share classes failed to outperform their respective benchmarks. The one exception is the Mirova Global Green Bond Fund N share class that beat the global benchmark by an average annual 2 bps. The performance differentials applicable to both the Calvert Green Bond Fund and the other two Mirova share classes are, in part, sourced to these funds’ expense ratios. In the case of the VanEck Green Bond ETF, however, the lag is largely attributable to the fund’s legacy investment strategy that involved investing in non-US dollar denominated bonds. This changed effective September 1, 2019.
Global green bonds new issue volume surged in September, adding $72.3 billion and pushing the year-to-date volume to $349.5 billion
Global green bonds experienced a surge in new issue volume, adding $72.3 billion versus $10.8 billion in August and pushing the year-to-date volume to $349.5 billion based on adjusted data. Refer to Chart 2. This level already exceeds last calendar year’s $269.5 billion with three full months left in 2021.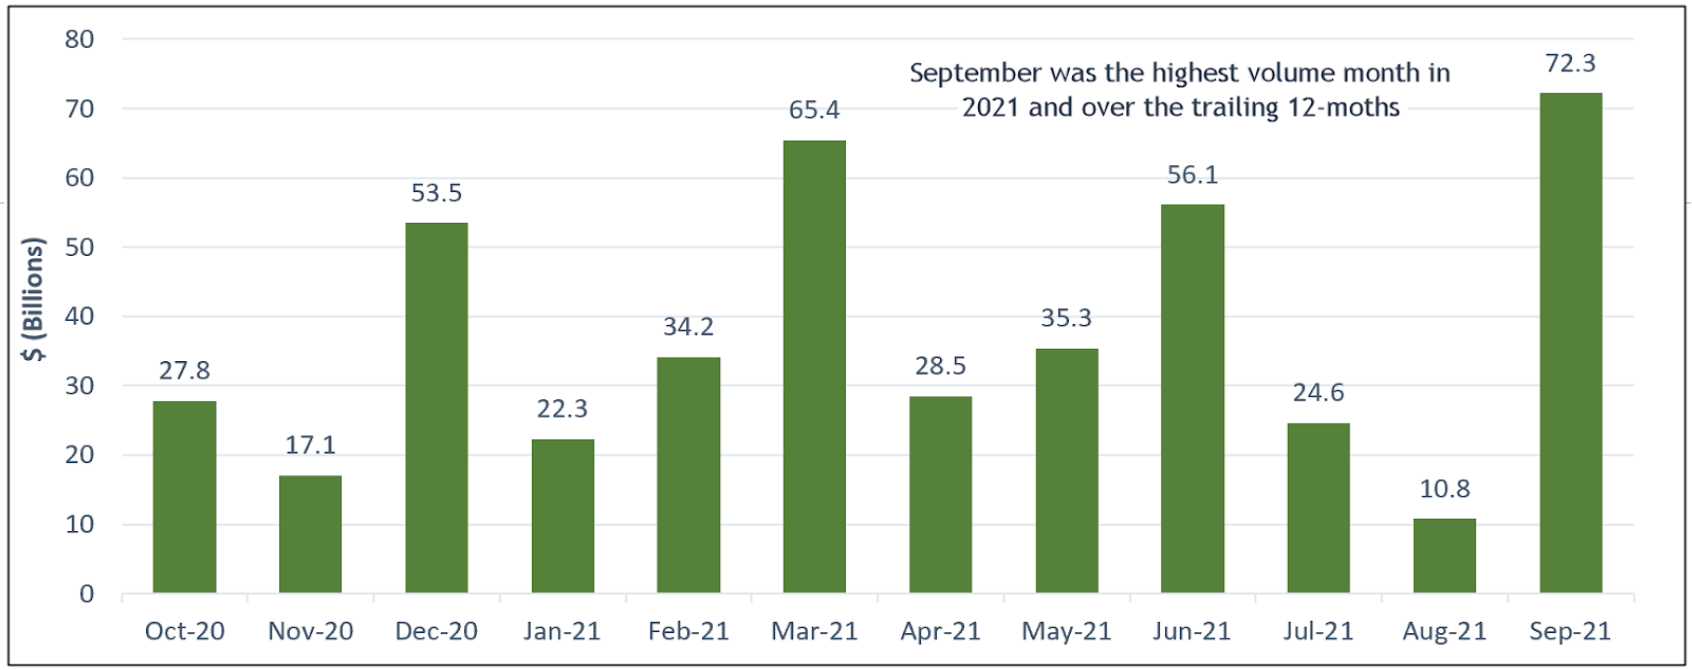
More broadly, sustainable bond volumes on a global basis have also been gaining momentum in 2021. According to Moody’s Investors, sustainable bonds, including green bonds, social bonds, sustainability bonds and sustainability linked bonds reached $660 billion, versus $613 billion issued during the entire 2020 calendar year.
In both cases, sovereign issuances and continuing demand for sustainable bonds have contributed to the volume expansions. In September, both the Spanish and UK governments became first time green bond issuers, joining the ranks of about 16 countries that have issued sovereign green bonds to-date. Spain’s green bonds were issued on or about September 9th in the amount of 5 billion Euros, earmarking the proceeds to finance projects which promote the ecological transition. In particular, the proceeds are aimed at mitigating and adapting to climate change, the sustainable use and protection of water and sea resources, the transition to a circular economy, the prevention and control of pollution, and the protection and recovery of biodiversity and ecosystems. The UK government raised a reported 10 billion (pounds), to be allocated to projects such as zero-emissions buses, energy-efficient housing schemes, offshore wind projects and initiatives that improve climate adaptation such as flood defenses and biodiversity improvements. Sectors excluded from receiving bond proceeds include fossil fuel exploration, nuclear power, weapons, tobacco, gaming, palm oil and alcoholic beverages.
| Fund Name | 1-Month Return (%) | Y-T-D Return (%) | 12-Month Return (%) | 3-Year Return (%) | AUM ($M) | Expense Ratio (%) |
| Calvert Green Bond A | -0.77 | 0 | 0.17 | 4.91 | 88.9 | 0.73 |
| Calvert Green Bond I | -0.75 | 0.06 | 0.42 | 5.19 | 862.1 | 0.48 |
| Calvert Green Bond R6 | -0.74 | 0.07 | 0.47 | 9.3 | 0.43 | |
| Franklin Municipal Green Bond A | -0.97 | -0.55 | 2.26 | 1.2 | 0.71 | |
| Franklin Municipal Green Bond Adv | -0.95 | -0.49 | 2.32 | 8.3 | 0.46 | |
| Franklin Municipal Green Bond C | -1.01 | -0.66 | 2.15 | 0.2 | 1.11 | |
| Franklin Municipal Green Bond R6 | -0.95 | -0.46 | 2.37 | 0 | 0.44 | |
| iShares Global Green Bond ETF | -1.21 | 0.07 | -0.8 | 237.9 | 0.2 | |
| Mirova Global Green Bond A | -0.75 | -0.28 | 0.13 | 5.01 | 7 | 0.93 |
| Mirova Global Green Bond N | -0.77 | -0.2 | 0.41 | 5.32 | 8 | 0.63 |
| Mirova Global Green Bond Y | -0.78 | -0.22 | 0.36 | 5.28 | 30.1 | 0.68 |
| PIMCO Climate Bond A | -0.56 | 0.42 | 2.47 | 0.8 | 0.94 | |
| PIMCO Climate Bond C | -0.62 | 0.23 | 1.68 | 0.1 | 1.69 | |
| PIMCO Climate Bond I-2 | -0.53 | 0.5 | 2.77 | 1.9 | 0.64 | |
| PIMCO Climate Bond I-3 | -0.54 | 0.48 | 2.72 | 0.1 | 0.69 | |
| PIMCO Climate Bond Institutional | -0.53 | 0.52 | 2.87 | 17.4 | 0.54 | |
| TIAA-CREF Green Bond Advisor | -0.74 | 0.2 | 1.53 | 2.3 | 0.55 | |
| TIAA-CREF Green Bond Institutional | -0.74 | 0.21 | 1.55 | 29.7 | 0.45 | |
| TIAA-CREF Green Bond Premier | -0.75 | 0.17 | 1.43 | 1.1 | 0.6 | |
| TIAA-CREF Green Bond Retail | -0.76 | 0.04 | 1.27 | 7 | 0.78 | |
| TIAA-CREF Green Bond Retirement | -0.75 | 0.17 | 1.43 | 15.1 | 0.7 | |
| VanEck Green Bond ETF | -1.07 | -0.23 | 0.13 | 3.75 | 97.8 | 0.2 |
| Average/Total | -0.78 | 0.00 | 1.37 | 4.91 | 1,426.30 | 0.66 |
| Bloomberg US Aggregate Bond Index | -0.87 | 0.05 | -0.9 | 5.36 | ||
| Bloomberg Municipal Total Return Index | -0.72 | 0.27 | 1.1 | 5.06 | ||
| ICE BofAML Green Bond Index Hedged US | -1.22 | 01.3 | -0.25 | 5.30 |