The Bottom Line: Stocks, bonds and sustainable mutual funds and ETFs gained in November as well as all selected ESG screened indices across asset classes.
Stocks, as measured by the large cap S&P 500 Index, added another 5.6% last month after registering a gain of 8.1% in October
Stocks and bonds both notched increases in November. Stocks, as measured by the large cap S&P 500 Index, added another 5.6% last month after registering a gain of 8.1% in October. The index trended lower during the first seven trading days of the month through November 9th but gained 5.5% on November 10th once, it seems, there was greater clarification in the election results. The much-anticipated Republican wave didn’t materialize, the Democrats retained control of the Senate while Republicans won just enough seats in the House of Representatives to constitute a majority when the 118th Congress comes into session in January. The stock market remained in positive territory for the remainder of the month. November ended by registering the second highest one-day gain that month following Fed Chairman Powell’s remarks at the Brookings Institute in which he signaled a downshift in the pace of interest rates tightening that could happen as early as the next meeting of the Federal Reserve in December. He added that more rate hikes will be needed to tame inflation and said that the ultimate terminal rate may be higher than previously thought. Still, the S&P 500 added 5.38% on the day. Refer to Chart 1. That said, the large cap index on a year-to-date basis through the end of November still stood at a negative 13.1% and is likely to deliver the worst return since 2008 when the S&P 500 dropped -36.55%.
Equity markets outside the US also posted strong gains, with developed markets adding almost 11% while emerging market equities rallied by nearly 15%. China let the way with an increase of 29.7% while Taiwan and Korea added 22.2% and 14.9%, respectively.
The bond market also registered a strong month with yields in the US and Europe retreating significantly. Investment grade intermediate bonds posted a gain, after recording three successive monthly declines. The Bloomberg US Aggregate Bond Index was up 3.44% while the Bloomberg Global Aggregate Bond Index added 4.71%. Unless there is a significant pick up in December, calendar year 2022 results are likely to record the worst year since the start of the now Bloomberg US Aggregate Bond Index series that goes back to 1976.
Chart 1: S&P 500 Index cumulative price only rates of return-November 2022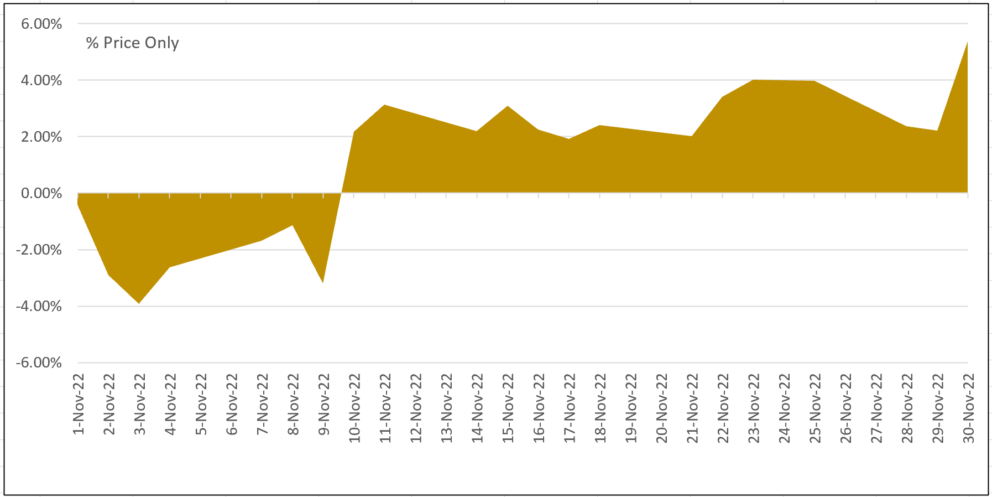 Source: Yahoo Finance
Sustainable mutual funds and ETFs recorded a positive average return of 6.8%, a second consecutive monthly average gain, while year-to-date returns are still down 14.07%
The universe of sustainable mutual funds and ETFs as defined by Morningstar, a total of 1,322 funds/share classes as of November 30, 2022 with $314 billion in assets across all asset classes, posted an average gain of 6.8% in November. At the same time, returns over the year-to-date and twelve-month intervals trailed by -14.07% and -12.2%, respectively.
The positive average results in November followed October’s average 3.96% gain. International funds, on average added 11.31%, US stock funds gained 6.01% and taxable bond funds also ended the month in positive territory, posting an average gain of 3.0%. All three categories also remain significantly in the red since the start of the year and over the trailing 12-month periods.
Across the board, returns in November ranged from a high of 29.3% achieved by the KraneShares MSCI China ESG Leaders ETF (KGRN), a fund that benefited from China’s 29.7% gain in November, to a low of -3.81% recorded by Eventide Exponential Technology Fund C (ETCEX). In both cases, November’s results had not yet erased significant year-to-date and 12-month outcomes that ranged from -30.1% to -43.39%, in that order.
Emerging markets funds, including China, were among the top performers in November. On the other hand, laggards included technology-focused funds as well as money market funds that also proved to be some of the best performing funds year-to-date. Refer to Table 1a and 1b.
Unlike last year when US large cap actively managed sustainable mutual funds outperformed conventional mutual funds on average (26.1% versus 23.9%), this year the reverse is likely to be true. Through the end of November, US large cap actively managed sustainable mutual funds posted a negative average return of 15.6% versus a negative 13.3% for their conventional mutual fund counterparts, or a negative variance of 2.3%. The average performance of conventional US large cap actively managed funds was more closely aligned to the S&P 500 Index that recorded a decline of 13.1% through the end of November.
Not only that, but about 54% of actively managed US large cap equity mutual funds have outperformed the S&P 500 Index on a year-to-date basis. Declining markets make active management skills all the more valuable, and based on data through the end of November, it looks like actively managed large cap equity funds are on track to achieve their best record of outperformance since 2009. The same can’t be said of US sustainable large cap equity mutual funds whose level of outperformance over the same interval is only at 25%, or 50% lower than conventional funds. Within this segment, however, 61% of growth oriented sustainable funds are beating the S&P 500 Growth Index.
Table 1a: Top 10 performing funds Table 1b: Bottom 10 performing funds
|
Fund Name
|
1-M TR
(%)
|
12-M TR (%)
|
Fund Name
|
1-M TR (%)
|
12-M TR (%)
|
|
KraneShares MSCI China ESG Leaders ETF
|
29.26
|
-32.96
|
BlackRock Wealth Liqd Envirtly Awr Inv A
|
0.28
|
1.08
|
|
Matthews Emerging Markets Sust Fut Inv
|
19.02
|
-14.2
|
Morgan Stanley Inst Lqdty ESG MMkt Ptcpt
|
0.27
|
0.99
|
|
Matthews Emerging Markets Sust Fut Inst
|
18.99
|
-14.13
|
BlackRock Wealth Liqd Envirtly Awr Inv C
|
0.22
|
0.69
|
|
Fidelity SAI Sustainable Em Markets Eq
|
18.97
|
|
Morgan Stanley Inst Lqdty ESG MMkt Admn
|
0
|
0
|
|
Fidelity Advisor® Sustainable EM Eq A
|
18.47
|
|
Morgan Stanley Inst Lqdty ESG MMkt Inv
|
0
|
0
|
|
Fidelity Sustainable Emerging Markets Eq
|
18.45
|
|
Changebridge Capital Sustainable Eq ETF
|
-2.69
|
-15.64
|
|
Fidelity Advisor® Sustainable EM Eq I
|
18.45
|
|
Eventide Exponential Technologies N
|
-3.74
|
-42.92
|
|
Fidelity Advisor® Sustainable EM Eq C
|
18.43
|
|
Eventide Exponential Technologies A
|
-3.74
|
-42.92
|
|
Fidelity Advisor® Sustainable EM Eq Z
|
18.42
|
|
Eventide Exponential Technologies I
|
-3.81
|
-42.83
|
|
Fidelity Advisor® Sustainable EM Eq M
|
18.35
|
|
Eventide Exponential Technologies C
|
-3.81
|
-43.39
|
Notes of Explanation: Performance covering both mutual funds and ETFs=total returns in percentage terms for periods ending November 30, 2022. 1-M=1 month, 12-M=12 months. Blank cells=fund was not in operation during entire interval. Source: Morningstar Direct.
All six selected ESG screened indices outperformed in November
For only the third time this year, all six selected MSCI ESG Leaders indices outperformed their conventional counterparts. These selected benchmarks, used as a barometer to gauge the performance of ESG-oriented strategies, consist of three international and foreign equity indices, two US stock indices and one fixed income index, all of which are comprised of companies with high ESG scores relative to sector peers. Positive variances ranged from 0.01% recorded by the Bloomberg MSCI ESG Focus Aggregate Bond Index to a variance of 2.07% registered by the MSCI Emerging Markets ESG Index.
With one exception, year-to-date results trailed behind conventional indices. The exception is the MSCI USA Small Cap ESG Index that beat its conventional counterpart by 136 basis points. At the same time, the index underperformed over the ten-year period while the five other ESG indices continued to outperform even as their levels of outperformance has narrowed this year.
Chart 2: Selected sustainable indices intermediate and long-term relative total return performance results to November 30, 2022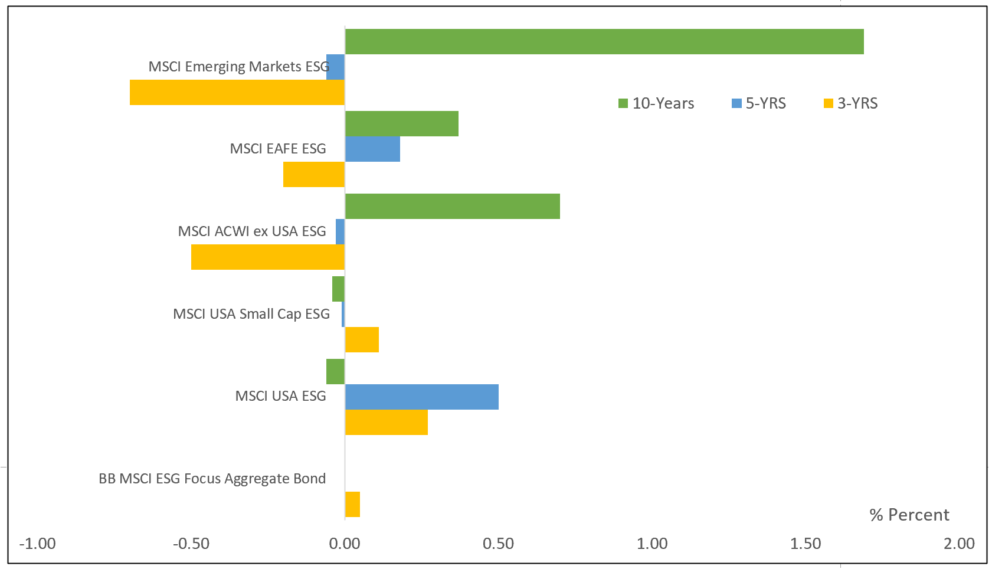 Notes of Explanation: The six MSCI ESG indices include the MSCI USA ESG Leaders Index consisting of large and mid-cap companies, MSCI USA Small Cap ESG Leaders Index, MSCI ACWI, ex USA, Leaders Index consisting of large and mid-cap companies in developed and developing countries, MSCI EAFE ESG Leaders Index consisting of large and mid-cap companies in developed markets. MSCI Leaders indices are constructed to provide exposure to companies with high ESG scores relative to their sector peers. Intermediate term covers 3 and 5 years. Long-term=10 years. Source: MSCI
SRA Select List of funds posted an average gain of 6.59% in November and -12.45% year-to-date
SRA Select funds posted an average increase of 6.59% in November, exceeding the 5.9% average increase registered by their corresponding conventional benchmarks¹. Excluding money market funds, returns ranged from low of 3.62% recorded by the iShares USD Green Green Bond ETF (BGRN) to a high of 16.44% posted by the iShares ESG MSCI EM Leaders ETF (LDEM). Refer to Table 2 for a complete rundown of SRA Select list of mutual funds and ETFs and their performance results over several time periods to November 30th.
The average performance of SRA Select funds trailed over the year-to-date and 12-month periods but led over the three years with an average performance of 2.91% versus 2.59% posted by the average performance of nine conventional indices.
Consisting of nine funds² pursuing discrete investment strategies intend for use as building blocks in the creation of a diversified ESG-oriented portfolio with varying weightings to more precisely reflect the financial and non-financial goals of investors, five of the nine funds outperformed their conventional benchmarks in November. Three of the nine funds beat their corresponding conventional indices for the year-to-date interval while only two funds each beat their conventional counterpart indices for the 12-months and trailing three-years³. (Refer to previously published article SRA Select Listing: ESG Integration Investment Fund Q1-2022 https://sustainableinvest.com/sra-select-listing-esg-integration-investment-funds-q1-2022/).
¹ To avoid duplications, these average results exclude Vanguard Treasury Money Market Fund and S&P 500 Index. ² A tenth fund, the Vanguard Treasury Money Market Fund, is an alternative money market fund. ³ iShares ESG MSCI EM Leaders Fund not in operation for the full 3-year time period to November 30, 2022.
Table 2: Performance of SRA Select listed mutual funds and ETFs-November 2022
Fund name/Index | Expense Ratio (%) | Assets ($ M) | 1-Month Total Return (%) | Y-T-D Total Return (%) | 12-M Total Return (%) | 3-Year TR (%) |
iShares ESG Advanced High Yield Corp Bd ETF (HYXF) | 0.35 | 124.9 | 1.6 | -11.36 | -9.78 | -0.74 |
iShares ESG Aware MSCI EAFE ETF (ESGD) | 0.2 | 6,884.3 | 13.81 | -13.3 | -8.87 | 2.79 |
iShares ESG Aware MSCI USA Small-Cap ETF (ESML) | 0.17 | 1,547.9 | 4.19 | -11.96 | -8.88 | 8.99 |
iShares ESG U.S. Aggregate Bond ETF (EAGG) | 0.1 | 2,149.6 | 3.7 | -12.61 | -12.92 | -2.69 |
iShares MSCI ACWI Low Carbon Target ETF (CRBN) | 0.2 | 877.2 | 8.6 | -14.96 | -11.62 | 6.89 |
iShares MSCI KLD 400 Social ETF (DSI) | 0.25 | 3,794.9 | 7.06 | -16.51 | -13.19 | 10.87 |
iShares USD Green Bond ETF (BGRN) | 0.2 | 289.2 | 3.62 | -12.7 | -13.61 | -3.39 |
iShares® ESG MSCI EM Leaders ETF (LDEM) | 0.16 | 60.5 | 16.44 | -19.69 | -19.04 | |
BlackRock Liquid Environmentally Aware Inv A (LEAXX) | 0.45 | 1,120.3 | 0.31 | 1.07 | 1.06 | 0.54 |
Vanguard Treasury Money Market Fund Investor (VUSXX) | 0.09 | 35,833.9 | 0.28 | 1.17 | 1.17 | 0.59 |
Averages/Total* | 0.23 | 16,848.8 | 6.59 | -12.45 | -10.76 | 2.91 |
S&P 500 Index | | | 5.59 | -13.1 | -9.21 | 10.91 |
MSCI USA Index | | | 5.44 | -14.43 | -11.05 | 10.72 |
MSCI USA Small Cap Index | | | 3.96 | -13.09 | -10.28 | 7.20 |
MSCI EAFE Index (Net) | | | 11.26 | -14.52 | -10.14 | 1.92 |
MSCI ACWI Index (Net) | | | 7.76 | -15.02 | -11.62 | 6.63 |
MSCI Emerging Markets Index (Net) | | | 14.83 | -18.95 | -17.43 | 0.14 |
Bloomberg U.S. Treasury Bill (1-3 M) | | | 0.31 | 1.16 | 1.17 | 0.63 |
Bloomberg U.S. Aggregate Bond Index | | | 3.68 | -12.62 | -12.84 | -2.59 |
Bloomberg U.S. Corporate High Yield Index | | | 2.17 | -10.63 | -8.96 | 0.92 |
S&P Green U.S. Dollar Select Index | | | 3.65 | -12.11 | -12.1 | -2.22 |
Averages** | | | 5.90 | -12.25 | -10.36 | 2.59 |
Notes of Explanation: Assets=Net Assets in millions. Blank cells=fund was not in operation during entire interval. *Average returns exclude the Vanguard Treasury Money Market Fund Investor. **Average returns exclude the S&P 500 Index to avoid double counting. Sources: Morningstar Direct and MSCI.
Stocks, bonds and funds notched increases in November
The Bottom Line: Stocks, bonds and sustainable mutual funds and ETFs gained in November as well as all selected ESG screened indices across asset classes. Stocks, as measured by the large cap S&P 500 Index, added another 5.6% last month after registering a gain of 8.1% in October
Share This Article:
The Bottom Line: Stocks, bonds and sustainable mutual funds and ETFs gained in November as well as all selected ESG screened indices across asset classes.
Stocks, as measured by the large cap S&P 500 Index, added another 5.6% last month after registering a gain of 8.1% in October
Stocks and bonds both notched increases in November. Stocks, as measured by the large cap S&P 500 Index, added another 5.6% last month after registering a gain of 8.1% in October. The index trended lower during the first seven trading days of the month through November 9th but gained 5.5% on November 10th once, it seems, there was greater clarification in the election results. The much-anticipated Republican wave didn’t materialize, the Democrats retained control of the Senate while Republicans won just enough seats in the House of Representatives to constitute a majority when the 118th Congress comes into session in January. The stock market remained in positive territory for the remainder of the month. November ended by registering the second highest one-day gain that month following Fed Chairman Powell’s remarks at the Brookings Institute in which he signaled a downshift in the pace of interest rates tightening that could happen as early as the next meeting of the Federal Reserve in December. He added that more rate hikes will be needed to tame inflation and said that the ultimate terminal rate may be higher than previously thought. Still, the S&P 500 added 5.38% on the day. Refer to Chart 1. That said, the large cap index on a year-to-date basis through the end of November still stood at a negative 13.1% and is likely to deliver the worst return since 2008 when the S&P 500 dropped -36.55%.
Equity markets outside the US also posted strong gains, with developed markets adding almost 11% while emerging market equities rallied by nearly 15%. China let the way with an increase of 29.7% while Taiwan and Korea added 22.2% and 14.9%, respectively.
The bond market also registered a strong month with yields in the US and Europe retreating significantly. Investment grade intermediate bonds posted a gain, after recording three successive monthly declines. The Bloomberg US Aggregate Bond Index was up 3.44% while the Bloomberg Global Aggregate Bond Index added 4.71%. Unless there is a significant pick up in December, calendar year 2022 results are likely to record the worst year since the start of the now Bloomberg US Aggregate Bond Index series that goes back to 1976.
Chart 1: S&P 500 Index cumulative price only rates of return-November 2022 Source: Yahoo Finance
Sustainable mutual funds and ETFs recorded a positive average return of 6.8%, a second consecutive monthly average gain, while year-to-date returns are still down 14.07%
The universe of sustainable mutual funds and ETFs as defined by Morningstar, a total of 1,322 funds/share classes as of November 30, 2022 with $314 billion in assets across all asset classes, posted an average gain of 6.8% in November. At the same time, returns over the year-to-date and twelve-month intervals trailed by -14.07% and -12.2%, respectively.
The positive average results in November followed October’s average 3.96% gain. International funds, on average added 11.31%, US stock funds gained 6.01% and taxable bond funds also ended the month in positive territory, posting an average gain of 3.0%. All three categories also remain significantly in the red since the start of the year and over the trailing 12-month periods.
Across the board, returns in November ranged from a high of 29.3% achieved by the KraneShares MSCI China ESG Leaders ETF (KGRN), a fund that benefited from China’s 29.7% gain in November, to a low of -3.81% recorded by Eventide Exponential Technology Fund C (ETCEX). In both cases, November’s results had not yet erased significant year-to-date and 12-month outcomes that ranged from -30.1% to -43.39%, in that order.
Emerging markets funds, including China, were among the top performers in November. On the other hand, laggards included technology-focused funds as well as money market funds that also proved to be some of the best performing funds year-to-date. Refer to Table 1a and 1b.
Unlike last year when US large cap actively managed sustainable mutual funds outperformed conventional mutual funds on average (26.1% versus 23.9%), this year the reverse is likely to be true. Through the end of November, US large cap actively managed sustainable mutual funds posted a negative average return of 15.6% versus a negative 13.3% for their conventional mutual fund counterparts, or a negative variance of 2.3%. The average performance of conventional US large cap actively managed funds was more closely aligned to the S&P 500 Index that recorded a decline of 13.1% through the end of November.
Not only that, but about 54% of actively managed US large cap equity mutual funds have outperformed the S&P 500 Index on a year-to-date basis. Declining markets make active management skills all the more valuable, and based on data through the end of November, it looks like actively managed large cap equity funds are on track to achieve their best record of outperformance since 2009. The same can’t be said of US sustainable large cap equity mutual funds whose level of outperformance over the same interval is only at 25%, or 50% lower than conventional funds. Within this segment, however, 61% of growth oriented sustainable funds are beating the S&P 500 Growth Index.
Table 1a: Top 10 performing funds Table 1b: Bottom 10 performing funds
Fund Name
1-M TR
(%)
12-M TR (%)
Fund Name
1-M TR (%)
12-M TR (%)
KraneShares MSCI China ESG Leaders ETF
29.26
-32.96
BlackRock Wealth Liqd Envirtly Awr Inv A
0.28
1.08
Matthews Emerging Markets Sust Fut Inv
19.02
-14.2
Morgan Stanley Inst Lqdty ESG MMkt Ptcpt
0.27
0.99
Matthews Emerging Markets Sust Fut Inst
18.99
-14.13
BlackRock Wealth Liqd Envirtly Awr Inv C
0.22
0.69
Fidelity SAI Sustainable Em Markets Eq
18.97
Morgan Stanley Inst Lqdty ESG MMkt Admn
0
0
Fidelity Advisor® Sustainable EM Eq A
18.47
Morgan Stanley Inst Lqdty ESG MMkt Inv
0
0
Fidelity Sustainable Emerging Markets Eq
18.45
Changebridge Capital Sustainable Eq ETF
-2.69
-15.64
Fidelity Advisor® Sustainable EM Eq I
18.45
Eventide Exponential Technologies N
-3.74
-42.92
Fidelity Advisor® Sustainable EM Eq C
18.43
Eventide Exponential Technologies A
-3.74
-42.92
Fidelity Advisor® Sustainable EM Eq Z
18.42
Eventide Exponential Technologies I
-3.81
-42.83
Fidelity Advisor® Sustainable EM Eq M
18.35
Eventide Exponential Technologies C
-3.81
-43.39
Notes of Explanation: Performance covering both mutual funds and ETFs=total returns in percentage terms for periods ending November 30, 2022. 1-M=1 month, 12-M=12 months. Blank cells=fund was not in operation during entire interval. Source: Morningstar Direct.
All six selected ESG screened indices outperformed in November
For only the third time this year, all six selected MSCI ESG Leaders indices outperformed their conventional counterparts. These selected benchmarks, used as a barometer to gauge the performance of ESG-oriented strategies, consist of three international and foreign equity indices, two US stock indices and one fixed income index, all of which are comprised of companies with high ESG scores relative to sector peers. Positive variances ranged from 0.01% recorded by the Bloomberg MSCI ESG Focus Aggregate Bond Index to a variance of 2.07% registered by the MSCI Emerging Markets ESG Index.
With one exception, year-to-date results trailed behind conventional indices. The exception is the MSCI USA Small Cap ESG Index that beat its conventional counterpart by 136 basis points. At the same time, the index underperformed over the ten-year period while the five other ESG indices continued to outperform even as their levels of outperformance has narrowed this year.
Chart 2: Selected sustainable indices intermediate and long-term relative total return performance results to November 30, 2022 Notes of Explanation: The six MSCI ESG indices include the MSCI USA ESG Leaders Index consisting of large and mid-cap companies, MSCI USA Small Cap ESG Leaders Index, MSCI ACWI, ex USA, Leaders Index consisting of large and mid-cap companies in developed and developing countries, MSCI EAFE ESG Leaders Index consisting of large and mid-cap companies in developed markets. MSCI Leaders indices are constructed to provide exposure to companies with high ESG scores relative to their sector peers. Intermediate term covers 3 and 5 years. Long-term=10 years. Source: MSCI
SRA Select List of funds posted an average gain of 6.59% in November and -12.45% year-to-date
SRA Select funds posted an average increase of 6.59% in November, exceeding the 5.9% average increase registered by their corresponding conventional benchmarks¹. Excluding money market funds, returns ranged from low of 3.62% recorded by the iShares USD Green Green Bond ETF (BGRN) to a high of 16.44% posted by the iShares ESG MSCI EM Leaders ETF (LDEM). Refer to Table 2 for a complete rundown of SRA Select list of mutual funds and ETFs and their performance results over several time periods to November 30th.
The average performance of SRA Select funds trailed over the year-to-date and 12-month periods but led over the three years with an average performance of 2.91% versus 2.59% posted by the average performance of nine conventional indices.
Consisting of nine funds² pursuing discrete investment strategies intend for use as building blocks in the creation of a diversified ESG-oriented portfolio with varying weightings to more precisely reflect the financial and non-financial goals of investors, five of the nine funds outperformed their conventional benchmarks in November. Three of the nine funds beat their corresponding conventional indices for the year-to-date interval while only two funds each beat their conventional counterpart indices for the 12-months and trailing three-years³. (Refer to previously published article SRA Select Listing: ESG Integration Investment Fund Q1-2022 https://sustainableinvest.com/sra-select-listing-esg-integration-investment-funds-q1-2022/).
¹ To avoid duplications, these average results exclude Vanguard Treasury Money Market Fund and S&P 500 Index. ² A tenth fund, the Vanguard Treasury Money Market Fund, is an alternative money market fund. ³ iShares ESG MSCI EM Leaders Fund not in operation for the full 3-year time period to November 30, 2022.
Table 2: Performance of SRA Select listed mutual funds and ETFs-November 2022
Fund name/Index
Expense Ratio (%)
Assets
($ M)
1-Month Total Return (%)
Y-T-D Total Return (%)
12-M Total Return (%)
3-Year
TR
(%)
iShares ESG Advanced High Yield Corp Bd ETF (HYXF)
0.35
124.9
1.6
-11.36
-9.78
-0.74
iShares ESG Aware MSCI EAFE ETF (ESGD)
0.2
6,884.3
13.81
-13.3
-8.87
2.79
iShares ESG Aware MSCI USA Small-Cap ETF (ESML)
0.17
1,547.9
4.19
-11.96
-8.88
8.99
iShares ESG U.S. Aggregate Bond ETF (EAGG)
0.1
2,149.6
3.7
-12.61
-12.92
-2.69
iShares MSCI ACWI Low Carbon Target ETF (CRBN)
0.2
877.2
8.6
-14.96
-11.62
6.89
iShares MSCI KLD 400 Social ETF (DSI)
0.25
3,794.9
7.06
-16.51
-13.19
10.87
iShares USD Green Bond ETF (BGRN)
0.2
289.2
3.62
-12.7
-13.61
-3.39
iShares® ESG MSCI EM Leaders ETF (LDEM)
0.16
60.5
16.44
-19.69
-19.04
BlackRock Liquid Environmentally Aware Inv A (LEAXX)
0.45
1,120.3
0.31
1.07
1.06
0.54
Vanguard Treasury Money Market Fund Investor (VUSXX)
0.09
35,833.9
0.28
1.17
1.17
0.59
Averages/Total*
0.23
16,848.8
6.59
-12.45
-10.76
2.91
S&P 500 Index
5.59
-13.1
-9.21
10.91
MSCI USA Index
5.44
-14.43
-11.05
10.72
MSCI USA Small Cap Index
3.96
-13.09
-10.28
7.20
MSCI EAFE Index (Net)
11.26
-14.52
-10.14
1.92
MSCI ACWI Index (Net)
7.76
-15.02
-11.62
6.63
MSCI Emerging Markets Index (Net)
14.83
-18.95
-17.43
0.14
Bloomberg U.S. Treasury Bill (1-3 M)
0.31
1.16
1.17
0.63
Bloomberg U.S. Aggregate Bond Index
3.68
-12.62
-12.84
-2.59
Bloomberg U.S. Corporate High Yield Index
2.17
-10.63
-8.96
0.92
S&P Green U.S. Dollar Select Index
3.65
-12.11
-12.1
-2.22
Averages**
5.90
-12.25
-10.36
2.59
Notes of Explanation: Assets=Net Assets in millions. Blank cells=fund was not in operation during entire interval. *Average returns exclude the Vanguard Treasury Money Market Fund Investor. **Average returns exclude the S&P 500 Index to avoid double counting. Sources: Morningstar Direct and MSCI.
Sustainableinvest.com
Benefits
Free access to regularly updated original research and analysis focused exclusively on sustainable finance and investing, providing investors with the guidance needed to make informed investment decisions that align with their personal values and financial goals while also contributing to the advancement of positive long-term environmental and social outcomes.
By offering financial support for our current work, either in the form of a one-time or regular contributions, you help to defray some of the costs associated with conducting our research and analysis as well as to maintain the www.sustainableinvest.com website.
Helping us to expand our research capabilities and offerings over time to cover additional relevant topics geared to sustainable investors.
Sign up to free newsletters.
By submitting this form, you are consenting to receive marketing emails from: . You can revoke your consent to receive emails at any time by using the SafeUnsubscribe® link, found at the bottom of every email. Emails are serviced by Constant Contact